Tech Reports
Yearly reports from the Chapel Tech Committee on YouTube, social media, the website, Zoom streaming, finances and projects. Pick a year.
Tech Report - 2026
Data as of: June 1, 2026
Chapel Tech Summary
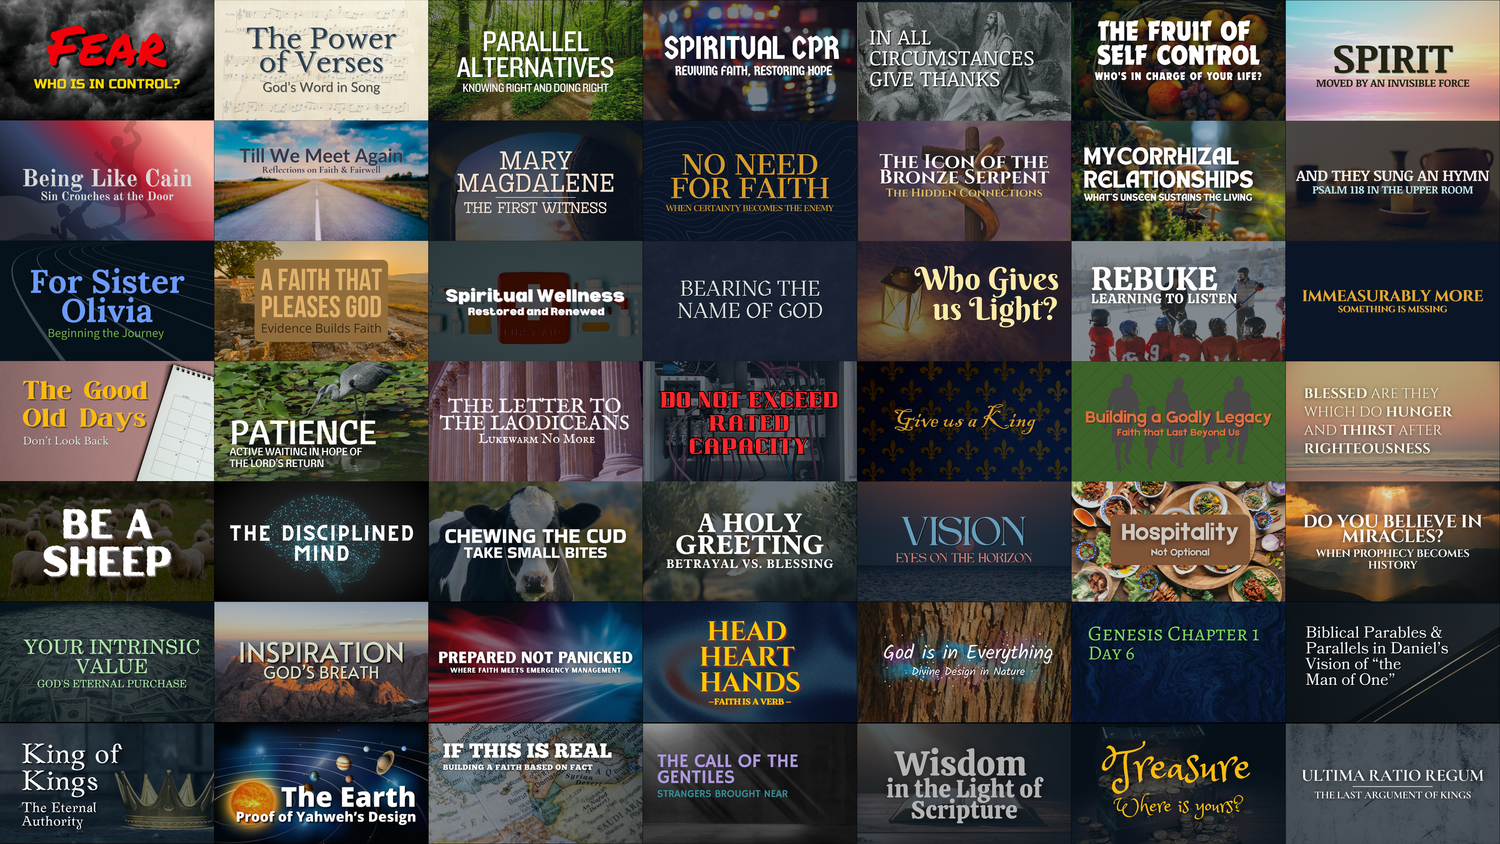
YouTube reached 353 subscribers and 1k+ videos. More complete summaries and custom thumbnails are boosting performance, particularly for exhortation content.
Social Media continues expanding on Facebook and Instagram, with Facebook showing the most engagement growth. Thanks to Becky & Team for creating great content!
Website attracted visitors from 99 countries and 48 states, with increases in both unique visits and pageviews.
Zoom streaming maintains community connection, with church services showing the best viewership growth.
Email List stayed steady with 158 subscribers, sharing updates and prayer requests with members and friends.
Online Donations positive results from Zeffy, which reduces fees and allows for easy special-event collection
Network Upgrades allows for network expandability and creates stable backbone for audio/video/networking
Substantial Hardware Upgrades getting quotes on audio upgrades (old system) and lighting updates (stage lighting & improved house lighting).
YouTube
- General Updates
- Summary for all videos
- Custom Thumbnails for all Exhortations
- Total Subscribers: 353 (▲12%)
- Total Videos: 1k+
- Yearly Views: 5.3K (▼32%)
- Yearly Watch Time (hours): 655 (▼27%)
- Yearly Impressions 123k (▼62%)
Social Media
Website
- Total Visits: 16k (▲23%)
- Unique Visits: 8k (▲16%)
- Pageviews: 26k (▲18%)
- Visits - 99 Countries (▲30%)
- Visits - 48 States (0%) Missing Alaska & South Dakota
Weekly Zoom Streaming
- 1 Adult Sunday School
- 1 Church Service
- 4 Weekly Bible Classes
- 1 Monthly Prayer Meeting
Average Viewers - 12
- Adult Sunday School: 15 (▲25%)
- Church Service: 37 (▼3%)
- Bible Classes
- North Richmond: 10 (▲11%)
- South Richmond: 11 (▼8%)
- Sunday & Tuesday: 5 (0%)
Total Viewers - 1,842
Tech Finances
Website Donations in past year:
- Donorbox: $2,284
- Zeffy: $16,405
- Spaghetti Sunday: $885
- Bake Sale: $51
- Total: $19,625
NOTE: All Future Donations should be done through Zeffy
Completed Projects
- Hardware Upgrades
- Smart Keypad Door Entry
- Soundboard
- Server Rack
- Network Switch
- Firewall
- 2x Access Points
- Battery Backup
- Software Upgrades
- Updated guest wifi
Ongoing & Future Projects
- Sunday Morning Tech
- 300+ hymns / year
- Running Streaming/Audio/Slides
- Camera security system - In Planning
- New Lighting - Getting Quotes
- New Sound Setup - Getting Quotes
- New Video Switch - In Planning
- New Camera & Controller - In Planning
Tech Report - 2025
Data as of: June 1, 2025
Chapel Digital Growth Summary
Our online presence grew this year across all platforms:
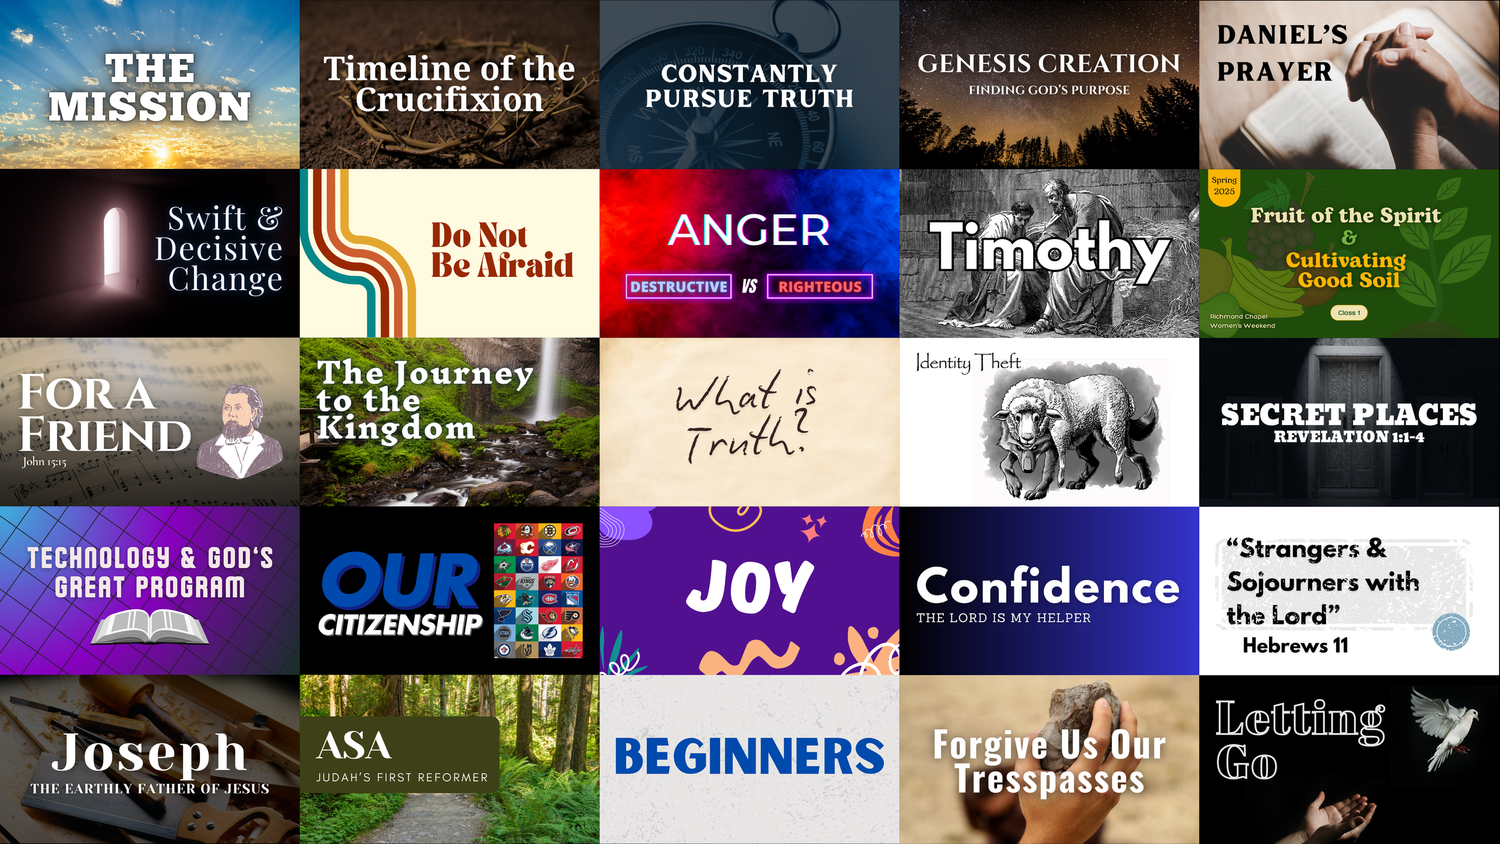
YouTube reached 316 subscribers and 934 videos with increases in views and engagement. AI-generated summaries and custom thumbnails are boosting performance, particularly for exhortation content.
Social Media continues expanding on Facebook and Instagram, with Instagram showing the most engagement growth.
Website attracted visitors from 76 countries and 48 states, with increases in both unique visits and pageviews.
Zoom streaming maintains community connection, with church services showing the best viewership growth.
Email List grew from 143 to 160 subscribers, sharing updates and prayer requests with members and friends.
Online Donations grew after switching to Zeffy, which reduced fees while increasing overall giving compared to Donorbox.
YouTube
- General Updates
- AI Summary for all descriptions
- Custom Thumbnails for all Exhortations
- Total Subscribers: 316 (▲24%)
- Total Videos: 934 (▲15%)
- Yearly Views: 7.7K (▲12%)
- Yearly Watch Time (hours): 901 (▲19%)
- Yearly Impressions 321k (▲28%)
Social Media
- Facebook: 799 (▲12%)
- Content Interactions: 851 (▼10%)
- Instagram: 250 (▲10%)
- Content Interactions: 745 (▲100%)
Website
- Total Visits: 13k (▲12%)
- Unique Visits: 6.9k (▲19%)
- Pageviews: 22k (▲10%)
- Visits - 76 Countries (▲7%)
- Visits - 48 States (-0%) Missing Alaska & North Dakota
Weekly Zoom Streaming
- 1 Adult Sunday School
- 1 Church Service
- 4 Weekly Bible Classes
- 1 Monthly Prayer Meeting
Average Viewers - 14
- Adult Sunday School: 12 (-0%)
- Church Service: 38 (▲21%)
- Bible Classes
- North Richmond: 9 (▼11%)
- South Richmond: 12 (▲18%)
- Sunday & Tuesday: 5 (▼18%)
- Women’s Class: 11 (▼37%)
Total Viewers - 2,406
Tech Finances
Website Donations in past year:
- Donorbox: $2,990
- Zeffy: $17,676
- Spaghetti Sunday: $400
- Bake Sale: $500
- Total: $20,666 (▲35%)
NOTE: All Future Donations should be done through Zeffy
Completed Projects
- Hardware Upgrades
- Smart Keypad Door Entry
- Smart smoke alarms
- 2 x Computers
- 2 x Monitors
- 2 x Microphones
- Keyboard & Mouse
- Tech Desk
- Server Rack
- Battery Backup
- Software Upgrades
- Free Patch Management
- Free Nonprofit MS Office Setup
Ongoing & Future Projects
- Sunday Morning Tech
- 300+ hymns / year
- Running Streaming/Audio/Slides
- Camera security system - In Planning
- New Lighting - Quoted
- New Wiring Setup - In Planning
- New Sound Board - In Planning
- New Video Switch - In Planning
Tech Report - 2024
Data as of: June 1, 2024
Summary
YouTube The YouTube channel has grown to 268 subscribers and 798 videos, despite a slight decline in views to 6.9K and watch time to 746 hours. The channel continues to increase content with Exhortations, Sunday School, and Bible classes, and there's been a notable rise in closed caption use, which now stands at 1,127.
Social Media On social media, the chapel's presence has strengthened with Facebook followers growing to 712 and an impressive reach of 6,600. Instagram has also seen an increase, reaching 227 followers. Thanks to the team that works on this!
Website The website has attracted 12.4K visits from 71 countries and 48 states, with Virginia and Oregon being the most engaged regions. Although there has been a slight decrease in overall visits and page-views, the geographic diversity of visitors highlights the chapel's overall reach.
Zoom Weekly Zoom streaming has been a key tool in maintaining connection with the community both in Richmond and around the world, engaging a total of 4,077 viewers across various services and classes. Church services have an average of 31 viewers, while Bible classes and other activities also see consistent attendance.
Chapel Email List The chapel's Google Group is steadily growing, now with 143 subscribers. This platform ensures that all important updates reach everyone promptly, keeping dedicated members and interested friends informed about upcoming events, available resources, and prayer requests.
Online Donations Online donations through the website have totaled $15,330, an increase of $2,550 over last year. Please note to help save on processing fees, all donations should go through our new platform Zeffy.com (accessible via the Chapel Members page).
Future Plans Looking ahead, the Tech Committee plans to enhance its infrastructure with a smart keypad door entry (with keys still usable) and camera security system. Additionally, there are plans to upgrade the audio-visual equipment in the tech area at the back of the chapel, enhancing the overall experience for both in-person and virtual attendees.
Detailed information available below.
YouTube
- Total Subscribers: 268 (increased 39)
- Total Videos: 798 (increase 142)
- Yearly Views: 6.9K (decreased 670)
- Yearly Watch Time (hours): 746 (decreased 423)
- Average view duration (minutes): 6:27 (decreased 2:50)
- Yearly Impressions 235.7k (increased 42k) - How many times video thumbnails were shown to viewers
- Impressions Click Through Rate: 1.9% (decreased .2%) - How many people click on suggested videos
- Closed Caption Use: 1,127 (increased 405)
Social Media
- Facebook: 712 (increased 98)
- Facebook Page Reach: 6,600 (increased 5,473)
- Instagram: 227 (increased 21)
- Instagram Reach: 1,600 (decreased 3687)
Website
- Unique Visitors
- Visits
- Pageviews
- Total Visits: 12.4k (decreased 600)
- Unique Visits: 5.9k (decreased 100)
- Pageviews: 20k (decreased 2,000)
- Visits - 71 Countries (increased 32)
- Visits - 48 States (5.6k Virginia, 1.5k Oregon)
Weekly Zoom Streaming
- 1 Adult Sunday School
- 1 Church Service
- 4 Weekly Bible Classes
- 1 Monthly Prayer Meeting
Average Viewers - 15
- Adult Sunday School: 12
- Church Service: 31
- Bible Classes
- North Richmond: 10
- South Richmond: 10
- Sunday & Tuesday: 6
- Monthly Prayer Meeting: 20
- Women’s Day Class: 16
Total Viewers - 4,077
- Adult Sunday School: 619
- Church Service: 1,854
- Bible Classes
- North Richmond: 364
- South Richmond: 484
- Sunday & Tuesday: 318
- Monthly Prayer Meeting: 334
- Monthly Women’s Day Class: 33
Tech Finances
Website Donations in past year:
- Donorbox: $12,299
- Zeffy: $3,031
- Total: $15,330 (increase $2,550)
NOTE: All Future Donations should be done through Zeffy
Ongoing & Future Projects
- Smart Keypad Door Entry (will allow keyed entry as well) - Installed soon
- Camera security system - In Planning
- AV Upgrades - In Planning
The Tech committee is always looking for volunteers
Tech Report - 2023
Data as of: June 1, 2023
YouTube
- Total Subscribers: 229 (increased 43)
- Total Videos: 656
- Yearly Views: 7.6K (increased 2.2k)
- Yearly Watch Time (hours): 1,169 (increased 329)
- Average view duration (minutes): 9:13 (decreased 3 seconds)
- Yearly Impressions 193k (increased 100k) - How many times video thumbnails were shown to viewers
- Impressions Click Through Rate: 2.1% (decreased .8%) - How many people click on suggested videos
- Closed Caption Use: 722 (increased 456)
Social Media
- Facebook: 614 (increased 155)
- Facebook Page Reach: 1,029 (decreased 23%)
- Instagram: 206 (increased 44)
- Instagram Reach: 5,287 (Increased 4.3k%)
Website
- Unique Visitors
- Visits
- Pageviews
- Total Visits: 13k (+13% yr/yr)
- Unique Visits: 6k (+24% yr/yr)
- Pageviews: 22k (+7% yr/yr)
- Visits - 39 Countries
- Visits - 45 States (5.2k Virginia, 2.4k Oregon)
Weekly Zoom Streaming
- 1 Adult Sunday School
- 1 Church Service
- 3 Weekly Bible Classes
- 1 Monthly Prayer Meeting
- 1 Monthly Women’s Day Class
Average Viewers - 15
- Adult Sunday School: 11
- Church Service: 40
- Bible Classes: 10
- Monthly Prayer Meeting: 14
- Monthly Women’s Day Class: 17
Total Viewers - 4,662
- Adult Sunday School: 580
- Church Service: 2,187
- Bible Classes: 1,441
- Monthly Prayer Meeting: 155
- Monthly Women’s Day Class: 241
Tech Finances
- Reviewed Internet Savings - Removed Phone & Negotiated Lower pricing (decreased cost $1200/year)
- Reviewed Website Plan - Lowered Plan (decreased cost $84/year) ($120 1st year savings)
- Website Donations (Donorbox) in past year
- Total $12,780 (increase $267)
- Average $107.40 (increase $2.25)
Ongoing & Future Projects
- Projected Hymns for in-person/remote - Ongoing
- General AV Upgrades - In Planning
- Migrate website to New Squarespace Version - Completed
- Setup and Management of UCA Directory Listing - Completed
The Tech committee is always looking for volunteers
Tech Report - 2022
Data as of: June 1, 2022
YouTube (June 1, 2021 - May 31, 2022)
- Total Subscribers: 186 (increased 39)
- Total Videos: 632 (increased 157)
- Yearly Views: 5.4K (decreased 2.7k)
- Yearly Watch Time (hours): 840 (decreased 435)
- Average view duration (minutes): 9:16 (decreased 6 seconds)
- Yearly Impressions 93k (decreased 76k) - How many times video thumbnails were shown to viewers
- Impressions Click Through Rate: 2.9% (increased 1%) - How many people click on suggested videos
- Closed Caption Use: 266 (increased 143)
Social Media
Website
Total Visits: 11k (-21% year/year)
Unique Visits: 4.8 (-11% year/year)
Weekly Zoom Streaming
- 1 Adult Sunday School
- 3 Weekly Bible Classes
- 1 Church Service
- 1 Monthly Women’s Day Class
Average Viewers
- Adult Sunday School: 13 viewers
- Church Service: 50 viewers
- Bible Classes: 14 viewers
Ongoing & Future Projects
- Projected Hymns for in-person/remote - Ongoing
- Website Donations (Donorbox) in past year
- Total $12,513 (increase $2,376)
- Average $105.15 (increase $13,82)
- Projector Switch Upgrade - In Planning
- New Soundboard - In Planning
- New Piano Mic - In Planning
- Migrate website to New Squarespace Version - In Planning
The Tech committee is always looking for volunteers
Tech Report - 2021
Data as of: June 1, 2021
YouTube (June 1, 2020 - May 31, 2021)
- Total Subscribers: 147 (increased 39)
- Total Videos: 475 (increased 156)
- Yearly Views: 8.2K (increased 3.2k)
- Yearly Watch Time (hours): 1.3k (increased 500)
- Yearly Impressions 169k (increased 119k) - How many times video thumbnails were shown to viewers.
Social Media
Website
Total Visits: 14k (+59% year/year)
Unique Visits: 5.4k (+13% year/year)
Visits - 31 Countries
Visits - 45 States (16% from Monmouth Oregon)
Weekly Zoom Streaming
- 4 Children’s Sunday Schools
- 1 Adult Sunday School
- 3 Weekly Bible Classes
- 1 Church Service
Average Viewers
- Adult Sunday School: 22 viewers
- Children Sunday School: All students
- Church Service: 74 viewers
- Bible Classes: 14 viewers
Completed Projects
- Projector Upgrade - October 2019
- Projector Connection Upgrade - Summer 2019
- Online Sunday School Management
- Online Bible Class Management
Ongoing & Future Projects
- Projected Hymns for in-person/remote - Ongoing
- Website Donations (Donorbox) in past year - $10,137.38 (Average $91.33) - Ongoing
- Projector Switch Upgrade - Winter 2021
- New Soundboard - Winter 2021
- Microsoft 365 through TechSoup - Summer 2021
- Documentation Refresh - Winter 2021
Tech Report - 2020
Data as of: June 1, 2020
YouTube
- Subscribers: 119 (increased 59)
- Videos: 121 (increased 76)
- Views: 9.6k (increased 5k)
- Watch Time (hours): 1.4k (increased 721)
Social Media
Google - Business Listing
- Views on Google Search/Maps: 38,587
- Action Taken: 844
- Website Visited: 647
- Directions Requested: 189
- Phone Calls: 8
Website
Visits - 27 Countries
Visits - 50 States
Weekly Zoom Streaming
- 4 Children’s Sunday Schools
- 1 Adult Sunday School
- 3 Weekly Bible Classes
- 1 Church Service
Average Viewers
- Adult Sunday School: 22 viewers
- Children Sunday School: All students
- Church Service: 86 viewers
- Bible Classes: 14 viewers
Completed Projects
- Projector Upgrade - October 2019
- Projector Connection Upgrade - Summer 2019
- Donations through Website in past year - $10,775
- COVID Resources - March 2020
- WCF Hymns for Sunday - April 2020
Ongoing & Future Projects
- All Zoom Meetings will Require Password - September 2020
- MS Office (TechSoup) - Fall 2020
- Projector Switch Upgrade - Spring 2021
Chapel Music
Sunday School
- 1 Guitarist
- 3 Pianists
Church Service
- 1 Organist
- 2 Pianists
Events
- Virtual Music Day #1:
- Hosted by Jessica & Nicolas
- Date: 3.28.20
- Attendees: 208
- Recording Views: 204
- Virtual Music Day #2
- Hosted by Susan, Kurt & Kate
- Date: 5.2.20
- Attendees: 178
- Recording Views: 171
Notes
- Schedule is created June-May
- Current music is organized by those attending in-person
- WCF Hymns for Sunday are used for streaming and continue to receive positive feedback. This should continue until adequate microphones can be setup at the chapel.
- Pianos have not been tuned since last year
- Children’s music continues to be requested
Tech Report - 2019
Data as of: June 2, 2019
Zoom Streaming
- Sunday School: 5
- Church Service: 23
YouTube
- Subscribers: 49 +38
- Videos: 121 +56
- Views: 3,003 +1,926
- Watch Time (hours): 362 +241
Social Media
Google - Business Listing
- Views on Google Search/Maps: 15,597
- Action Taken: 499
- Website Visited: 324
- Directions Requested: 174
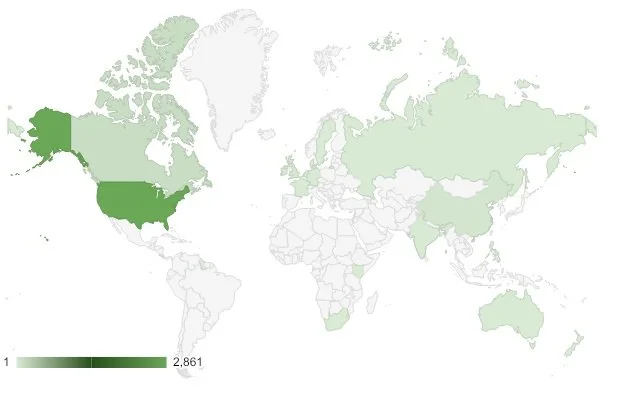
Visits - 22 Countries
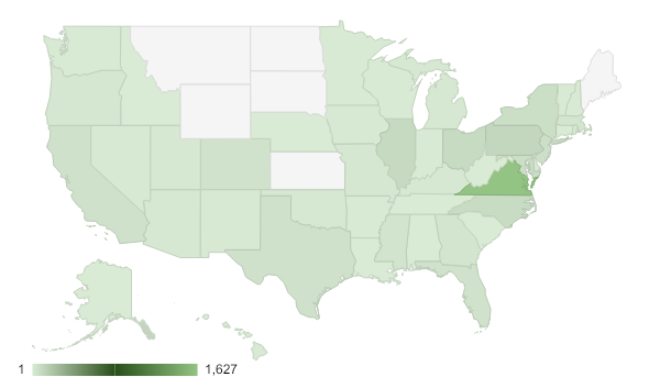
Visits - 44 States
Completed Projects
- Presider Notes Form - Summer 2018
- Donations on Website ($3k+ raised) - Summer 2018
- Memory Verses on Website - Fall 2018
- Website Changes (Resources) - Winter 2019
- Computer Repair - Spring 2019
- VGA Transmitter/Receiver Replacement - Spring 2019
- Projector Bulb Replacement - Spring 2019
- New Printer - Spring 2019
Ongoing & Future Projects
- MS Office (TechSoup) - Summer 2019
- Website Changes (Welcome/Beliefs) - Summer 2019
- Projector Connection Upgrade - Summer 2019
- Streaming Upgrade (Hymns) - Summer 2019
- Lighting Upgrade - Fall 2019
- Projector Upgrade - October 2019